The running total for EC's annual Big Steel Challenge...
The mission is simple:
How many lbs can the EC team move over the month of January?#Anabolic Cycle.
>
Thursday, January 16, 2014
Tuesday, December 10, 2013
Submax FTP Calculator
Alan Couzens, MS (Sports Science)
As you might have guessed from yesterday's post, I'm, generally, not a big fan of doing a lot of sustained work in or around the athlete's FTP. In relative terms, this is true throughout the year, but it's especially true in the early season, when both overall volume and the fitness base of the athlete is at the lowest point of the build. For most athletes, a 20min max TEST effort at or above FTP in the early season constitutes 'way too much' FTP work in my opinion/experience.
For coaches who use performance modeling software (WKO+, Training Peaks etc.) this represents a problem, as many of the calculated metrics rely on having an accurate, up to date, FTP number entered for the athlete &, at least to this point, the way to produce that number was via a maximal effort of at least 20min duration.
When a major unload is included (as it should be each year), there is a significant drop in the athlete's FTP number. For a good level AG male, this is typically in the range of 30-60 watts! If FTP is not adjusted, the training load (TSS) of each session will be significantly underestimated. This can lead to big problems in terms of over-doing the training load prescription and can even lead to an early season bout of overtraining that can really mess with the upcoming season. Bottom line: You shouldn't use last season's FTP number at the start of a new season.
But... we do need a number and the alternative to using last season's isn't a whole lot better in terms of risk of over-training. Do we really want our athlete to be blasting a "bleed from the eyeballs" 20min max effort coming straight out of a "keep moving but don't do anything structured" off-season prescription? I can attest from experience that we don't! Bad things happen when athletes with no aerobic base start doing maximal anaerobic efforts!
So, what's the solution?
I'll offer one here - a submaximal FTP calculator that uses the relatively linear relationship between HR and power (or pace) within the athlete's aerobic zones to 'project up the line' to what the athlete's FTP would be at threshold heart rate.
What you'll need....
* A true max heart rate value - this could be from any recent season as max HR is a relatively stable number.
* A current resting HR number.
* 2 submax efforts on a flat road/trainer where you lap for power or pace and HR. Ideally you'll come back to the same course for each test. Also, ideally you'll do the test under similar conditions (similar time of day, temp etc). These efforts should be sufficiently long that HR stabilizes for a good period of time but sufficiently short that decoupling isn't significant. Depending on fitness, something in the range of 2x10min to 2x20min works well.
* Do the first as close as possible to (but not exceeding) the top of your Steady heart rate zone (indicated by the HR number next to 65%)
* Rest for a sufficient period of time to bring HR & power back in line.
* Do the second as close as possible to (but not exceeding) the top of your Mod-Hard HR zone (indicated by the HR number next to 75%)
If you know your specific % MaxHR numbers (from a lactate test) for top of steady, mod-hard & threshold heart rates,, you can change the % numbers and enter them in the calculator. If not, use the recommended 65, 75, 85% Karvonen numbers given.
* Enter your average power or pace from the 2 intervals of the test in the white squares.
The calculator will spit out an estimate for your current functional threshold power or pace that you can then plug into Training Peaks or WKO+ to ensure more accurate TSS numbers in the early season.
When fitness improves and training shifts to include some more threshold work in the program, you can shift to the CP5/20 FTP/fatigue curve calculator for a more accurate estimate of FTP and more extensive assessment of strengths and weaknesses. This is a more informative test, but the athlete has to have a certain amount of base fitness to be able to include these tests on a sufficiently regular basis without it negatively affecting their training.
Hope you find it as useful as I have with my own athletes.
Train smart,
AC
Monday, December 9, 2013
Newsflash: You don't need to train at FTP to raise FTP!

Alan Couzens, MS (Sports Science)
"Ah, push it. Push it real good."
- Salt 'N Pepa
We just wrapped up a fun weekend at Endurance Corner with
our Coaches Clinic. We had coaches travel in to a frigid Boulder from all
corners of North America to learn about all aspects of coaching, from streamlining
business processes to the finer points of applied exercise physiology for
endurance athletes. As you might guess, I got pretty excited about some of the
discussions that arose from the latter. J
One of our presentations involved a demonstration of how to
both perform and analyze a lactate test for an endurance athlete. One of the
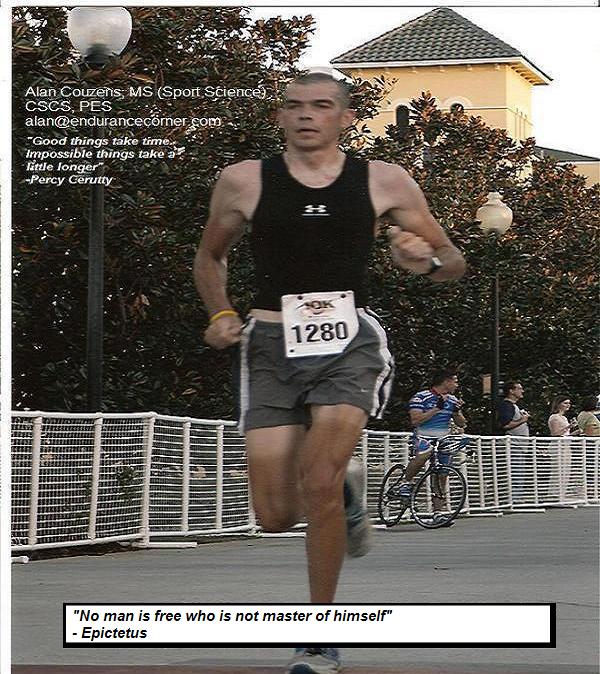
coaches brought along a (semi) willing guinea pig (in full flight in above pic) and we had a lot of fun
chatting through his data. One of the suggestions that I made after looking at
his data was that, he was anaerobically very strong and aerobically a little
weak for his current category; local
Cat 3 cyclist (probably equivalent to a Cat 1 anywhere else in the U.S. J )
From this conclusion, I had some great discussions with the
various coaches about what this means from a practical (training) perspective.
In order to talk “apples and apples” with the field based coaches, one of the aerobic
markers that we chatted through was the OBLA and its field equivalent FTP. After
identifying FTP as a potential area for improvement, the knee-jerk response seemed
to be that this athlete would most benefit from a staple diet of 2x20’s in or
around their FTP.
The assumption seemed to be that an athlete would most
(only?) benefit from work that is specific to the training intensity that we’re
looking to improve. This is simply not the case. In fact, the work rate that we
see at this lactate balance point is a function of both the lactate being
produced by all muscle fibers up to that point, along with the ability of these
muscle fibers to ‘take up’ & use the lactate being produced. The fibers
that are best suited to this task are the slow twitch muscle fibers that are
best trained with long, voluminous efforts. The ability to train muscle fibers
that, by nature want to use carbohydrate as an energy source (&
consequently, want to produce
lactate) is limited at best.
This discussion reinforced the benefit of blood lactate
testing as a comprehensive ‘snapshot’ of all aspects of an athlete’s physiology
at a given point in time. In my opinion, for the information they provide, they
are significantly under-utilized by current coaches.
A good example of this ‘snapshot’ and the implications on
our ‘guinea pig’s’ training prescription can be seen in the example below.

However, despite this low intensity focus, the athlete’s
OBLA (& FTP) actually went up by ~25W! (via the modified Dmax method-scroll to bottom) If we drill a little deeper into the
2 curves, we can see why. The ‘fork in the road’ between the early base and
late base curves occurs way early (at the 200W point!). In fact, the gradient
of both curves beyond the 225W point are very similar in both curves, but the
benefit that the athlete gets by flattening out that 200-225W point, gets
carried all the way up to FTP!
More good news… these muscle fibers are sustainably
trainable. In other words, the ‘upside’ for mitochondrial proliferation & capillarization in the
slow twitch fibers from untrained to well trained is a multi-year proposition!
The improvements at this point on the curve can continue for a VERY LONG period
of time. For example, Coyle et al. (1990) found 41% greater capillarization in
the slow twitch muscle fibers for those athletes who had 10 years of consistent
endurance training under their belt vs those who had ‘only’ been endurance training
for 5. In fact, most of the difference in aerobic capacity between these 2
groups of athletes, came down to differences in the slow twitch (Type 1) muscle
fibers. This would gel with my own experience: While the ‘curvy bit’ of the
lactate curve is somewhat malleable, the big difference over the years comes by
pushing the whole thing further and further to the right (along the wattage
axis). As we do this, year after year, all points of the curve (including FTP)
move to the right.
Take home points….
·
Incorporate regular lactate testing into your
training to get a comprehensive snapshot of what’s going on (go in on a
portable machine with your buddies – it’s money well spent!)
·
Focus your long term training at the ‘fork in
the road’. All points north of this will benefit.
·
A little bit of specific work to flatten or
raise a specific point on the curve close to your event goes a long way. For
most of the year, in the immortal words of Salt & Pepa “Push it” (to the
right).
And above all….
Train smart,
ACMonday, November 25, 2013
Run Power Calculator
Alan Couzens, MS (Sports Science)
You'll find below a calculator that will give you an equivalent bike power (in watts) for a given running pace.
To use it, simply enter your weight (in lbs) in the first white cell then a given (flat) run pace (in the format h:m:ss) in the cell below. E.g. for 8:30/mi, enter "0:8:30". It will the spit out an equivalent energy output (in watts) on the bike.
A key element in my "energy pacing your ironman" pacing strategy (here and here) is that you negative split the race, i.e. that you're putting out more 'power' in the run portion of the race than you are for the bike portion. This calculator is particularly useful as a 'check in' on how well you accomplished this (or whether you left some time out there on the course).
Ideally, your "run power" should just about always be greater that your normalized power on the bike for any 70.3 or Ironman event.
This calculator is based on average economy numbers of 75W/L on the bike and 210ml/kg/km on the run. Actual equivalencies may vary a little with specific economy differences but this represents a good 'ball park' based on the average of triathletes that I have tested in the lab.
Hopefully, you find it useful & it can help to lead you to a PR in 2014.
Race smart!
AC
Sunday, November 24, 2013
Fatigue Curve Calculator
Alan Couzens, MS (Sports Science)
You'll find below a simple calculator to help you calculate your own fatigue curve (along with an estimate of your FTP)
To use, enter 2 or more best power numbers (from true max effort tests) for any of the durations listed - 5min, 20min, 60min, 2.5hr, 5hr, or an Ironman in which you ran well. Enter these in the white cells & clear the sample data from any cells that you don't have current data for. Ideally, these will be normalized power numbers (especially for the longer durations).
The curve produced will give you an estimate of FTP (the first number in the regression equation at the top of the chart -- y=....) and it will give you an index respresentative of your current 'fatigue curve'. For a 'key' on what this number means, scroll to the table in the middle of the article linked above. As a general rule of thumb, your % drop off each time the duration doubles will be ~2/3 of this index e.g. if that superscript # is -0.10, your fatigue rate is ~6.7% (0.10 x 2/3).
By tracking this 2 factor model over the course of a season, you'll not only gain a good sense of how your general aerobic fitness is improving (via the estimated FTP) but also how your strengths and weaknesses as an athlete are developing (via the fatigue index).
Happy data mining! :-)
AC
Thursday, November 21, 2013
3 Simple tests that can help you avoid Overtraining
Alan Couzens, MS (Sports Science)
 "Enter, stranger, but take heed
Of what awaits the sin of greed,
For those who take, but do not earn,
Must pay most dearly in their turn.
So if you seek beneath our floors
A treasure that was never yours,
Thief, you have been warned, beware
Of finding more than treasure there.”
― J.K Rowling, "Harry Potter & The Sorcerer's Stone"
So how do we go about keeping our training response moving forward at the fastest possible rate? What are some signs that we can use to help to tell us to ‘back off’?
3. simple measures have been consistently linked with both the (‘red light’) overtraining syndrome and the (‘yellow light’) blunted training response…
However, a ‘low tech’ alternative that I’ve found useful (that I stole from Eastern Bloc coaches) is to measure lying and standing heart rate each morning. The delta between these 2 measures, when recorded over a long period of time, is also a very good indicator of autonomic fatigue. For example, in the study referenced above, the group with the highest HRV also had the greatest gap between lying (sleeping) and standing (waking) heart rates (24bpm). The group with the lowest HRV had a mean difference of only 17bpm.
Your numbers may be different to these. Things like aerobic fitness, size of the athlete, gender, etc. will all come into play. The important thing from a practical standpoint is how this morning’s numbers compare with your normal. A difference of 6-8bpm from your normal is worth paying attention to and is likely a sign that something is a little ‘off’ and your training response for that day may be compromised. Remember, this gap amounted to a 12% difference in training response in the study. May be a good day to go easy?

When power and heart rate zones are known for an athlete (for a given block of training) it is very easy to include a short set in the standard warm up at a prescribed submaximal pace or power and watch what heart rate that elicits. For instance, an athlete with an AeT (bottom zone 2) power of 200W could include a standard 15min segment at 200W in the warm up prior to a key set with average HR (and ideally cadence) recorded for the segment. Similar to the resting data, heart rates on ‘normal’ days will tend to fall within a pretty narrow range of +/-5% (as shown on the chart above). This brings us to what I like to call the ‘2 zone rule’ of overtraining.
In practice, this means that, for the bulk of sessions, both HR & Power should fall within a 2 zone band. Even accounting for appropriate decoupling, athletes should avoid situations in which they are putting out easy watts at greater than steady HR and vice versa.
If we apply this to the ‘warm up’ test; on any given day, this athlete with an AeT of 200W should observe a heart rate somewhere in their easy-steady (Zone 1-2) range from their AeT power effort. If the athlete fails to elevate their heart rate to at least their easy zone or if their HR is already exceeding their steady zone, something may be amiss or, in the terms of this article, the athlete may be running up on a ‘yellow light’ & may wish to schedule an easier day (as training response is likely compromised).
We’re already time crunched. Maybe we don’t have time to do
a tap test every morning. But we all do have
time for a tap test with our feet – on the ground – every time we go for a run J As Bill Sweetenham
suggested, there is benefit to monitoring cadence during your warm up test,
whether swim, bike or run. When athletes are tired, cadence/technique is
affected. This has implications beyond simply indicating over-reaching. As
athletes and coaches, we have to ask the question, do we want to be performing
hard training under conditions of altered technique? Clearly, from an injury
risk standpoint, the answer is no! Therefore, this is perhaps the strongest tip
off to back off a little from any planned hard training on that day.
Similar to heart rate, ‘healthy’ cadence tends to operate within a range of ~+/-5%. A runner with a typical cadence of 87spm may see normal variation of ~4spm (83-91) but a difference of more than this might be a sign that the athlete is too tired to get a lot from their training that day. Similarly, in the pool, a swimmer who swims ‘steady’ at a normal rate of 45 spm may be considered significantly fatigued if it’s taking them 50spm to hold their normal warm up pace.
I used the red light, yellow light metaphor intentionally to suggest that whether you stop at or roll through these yellow lights is a judgment call. Make no mistake, load is and always will be a central element to performance. An athlete doesn’t achieve their potential by being excessively cautious. However, on the flip side, an athlete doesn’t achieve their potential by being reckless either. The middle road will balance risk and reward on any given day. The purpose of becoming aware of the above signs is to put the coach and athlete in a better position to make intelligent judgment calls. Things you may consider when you come up on a yellow light…
AC
Of what awaits the sin of greed,
For those who take, but do not earn,
Must pay most dearly in their turn.
So if you seek beneath our floors
A treasure that was never yours,
Thief, you have been warned, beware
Of finding more than treasure there.”
― J.K Rowling, "Harry Potter & The Sorcerer's Stone"
In my last article, I discussed the difference between
‘failing adaptation’ and ‘compromised adaptation’ & suggested that, as
coaches, we are far more likely to come across the second scenario, where an
athlete is not clinically overtrained to the point that he can no longer adapt
to training but rather just tired enough that he/she is not getting “all that
they deserve” out of the work that they’re putting in.
Because this situation is more subtle than full blown
over-training, the signs are also more subtle. The ability of a coach or
athlete to pay attention to and heed these signs is one factor that separates a
decent coach from a ‘master coach’. A decent coach will incorporate sufficient
recovery to ensure than an athlete keeps progressing safely over a long period
of time. A master coach will respond daily to the signs of the athlete so that
improvement is not only consistent but the rate of improvement is maximized.
So how do we go about keeping our training response moving forward at the fastest possible rate? What are some signs that we can use to help to tell us to ‘back off’?
3. simple measures have been consistently linked with both the (‘red light’) overtraining syndrome and the (‘yellow light’) blunted training response…
- Resting Heart Rate Variability
- Submaximal Exercise HR
- Neuromuscular Efficiency
1. Morning Heart Rate Variability/Resting-Standing
Delta
As noted in the previous study by Hautala et al.(2003),
lower levels of heart rate variability are a sign of autonomic fatigue and a
good predictor of a blunted training response. Considering a difference of
~20ms can amount to a difference of 12% improvement in VO2max off the same
training load, this is a number worth paying attention to!
Several systems are now available to monitor and record HRV
patterns to signal over-training and identify optimal days for loading. Most of
these companies tend to keep their algorithms proprietary and I have trust
issues so I’m not going to implicitly validate any of these systems JHowever, a ‘low tech’ alternative that I’ve found useful (that I stole from Eastern Bloc coaches) is to measure lying and standing heart rate each morning. The delta between these 2 measures, when recorded over a long period of time, is also a very good indicator of autonomic fatigue. For example, in the study referenced above, the group with the highest HRV also had the greatest gap between lying (sleeping) and standing (waking) heart rates (24bpm). The group with the lowest HRV had a mean difference of only 17bpm.
Your numbers may be different to these. Things like aerobic fitness, size of the athlete, gender, etc. will all come into play. The important thing from a practical standpoint is how this morning’s numbers compare with your normal. A difference of 6-8bpm from your normal is worth paying attention to and is likely a sign that something is a little ‘off’ and your training response for that day may be compromised. Remember, this gap amounted to a 12% difference in training response in the study. May be a good day to go easy?
Differences of larger than 8bpm are typical of more serious
situations like major physical or psychological stress – infection, very poor
sleep etc. On these days, no training or VERY light training may be most
appropriate.
I like to use morning heart rate as the first check in and
first ‘line of defense’ for the super-committed athlete. It offers a good
objective marker of where things might be headed. Rarely though, would I
suggest that the athlete not move onto the second step in their ‘readiness to
train’ assessment, i.e. some submaximal testing during the warm up of their
first session of the day….
2.
Submaximal
Exercise HR –
An even better indicator of a blunted training response is exercise
heart rate.
Studies have consistently shown that exercise heart rate is
affected when an athlete is over-reached. In the case of sympathetic
over-reaching, exercise HR is higher
for a given workload. In the case of parasympathetic over-reaching, it is lower. For example, Hedelin et al.
(2000) found a mean difference of 8bpm (~5%) at the same absolute workload when
a given athlete was (parasympathetically) over-reached. This ‘inverted U’
relationship between training response & high/low HRs for a given power
output is shown visually below.
This chart visually describes an important, if somewhat
obvious, physiological effect. When the body is already dealing with or
absorbing other stressors going into a workout (indicated by high or low HR)
the training response that the athlete gets from that workout will be compromised.
Smart coaches have used this effect as a good indicator of
when an athlete is ready for hard training. Swim coach, Bill Sweetenham, for
instance, has used the “individual checking test” as a readiness marker prior
to hard training sets. The test is simply a series of submaximal swims at a
prescribed pace, with note taken of the swimmers heart rate and stroke counts
and how they compared to “normal” for that swimmer. The triathlete who trains
with pace and power can take a similar approach…When power and heart rate zones are known for an athlete (for a given block of training) it is very easy to include a short set in the standard warm up at a prescribed submaximal pace or power and watch what heart rate that elicits. For instance, an athlete with an AeT (bottom zone 2) power of 200W could include a standard 15min segment at 200W in the warm up prior to a key set with average HR (and ideally cadence) recorded for the segment. Similar to the resting data, heart rates on ‘normal’ days will tend to fall within a pretty narrow range of +/-5% (as shown on the chart above). This brings us to what I like to call the ‘2 zone rule’ of overtraining.
In practice, this means that, for the bulk of sessions, both HR & Power should fall within a 2 zone band. Even accounting for appropriate decoupling, athletes should avoid situations in which they are putting out easy watts at greater than steady HR and vice versa.
If we apply this to the ‘warm up’ test; on any given day, this athlete with an AeT of 200W should observe a heart rate somewhere in their easy-steady (Zone 1-2) range from their AeT power effort. If the athlete fails to elevate their heart rate to at least their easy zone or if their HR is already exceeding their steady zone, something may be amiss or, in the terms of this article, the athlete may be running up on a ‘yellow light’ & may wish to schedule an easier day (as training response is likely compromised).
A worked example...
Our athlete's 'normal' AeT heart rate is 130bpm at an AeT power of 200W. However, on this day, he notices his heart rate is 140bpm (+8%), putting him into his 'yellow zone' and indicating his system may not be 'firing on all cylinders'.
You’ll note that Sweetenham recommends recording stroke
rate/length data during this test as well. There is a good reason for this…..
3. Neuromuscular efficiency
Fatigue of the neuro-endocrine system not only manifests on
the endocrine side of things, as highlighted above, but also on the neural side
of things. Therefore, things like co-ordination and rate of contraction are
affected. Soviet coaches have long used different measures of this to assess
over-training in their athletes. Things like hand dynamometers, vertical jump
tests and even simple ‘tap tests’ where an athlete finger taps as many times as
possible within a minute all help to discern the current state of an athlete’s
neurological system. In the case of this test, the Soviet coaches found a
significant difference between how many ‘taps’ the athlete could get done when
they were ‘normal’ vs when they were ‘fatigued’ and different still to when
they were ‘peaking’.
Similar to heart rate, ‘healthy’ cadence tends to operate within a range of ~+/-5%. A runner with a typical cadence of 87spm may see normal variation of ~4spm (83-91) but a difference of more than this might be a sign that the athlete is too tired to get a lot from their training that day. Similarly, in the pool, a swimmer who swims ‘steady’ at a normal rate of 45 spm may be considered significantly fatigued if it’s taking them 50spm to hold their normal warm up pace.
*****
So what do you do when you run up on a yellow light?I used the red light, yellow light metaphor intentionally to suggest that whether you stop at or roll through these yellow lights is a judgment call. Make no mistake, load is and always will be a central element to performance. An athlete doesn’t achieve their potential by being excessively cautious. However, on the flip side, an athlete doesn’t achieve their potential by being reckless either. The middle road will balance risk and reward on any given day. The purpose of becoming aware of the above signs is to put the coach and athlete in a better position to make intelligent judgment calls. Things you may consider when you come up on a yellow light…
·
Is there room within the week to bump this key session
to a different day (when the athlete is likely to get more response from it?)
& replace it with an easier session today?
·
Is this yellow light a one-off occurrence or am
I pushing my luck (and headed for a red light?)
·
Are there proactive things that I can do to get
back to ‘green light status’ as quickly as possible – catch up on sleep, get
some good food in the system, get a massage etc.
By paying attention to your yellow lights, you can minimize
the risk of unintended interruptions and keep yourself rolling smoothly towards
your destination.
Train smart,AC
Monday, September 23, 2013
Overtraining Part 1: The “Red Light/Yellow Light” Rules of Overtraining.

“Red light, yellow
light, green light, Go!” – Def Leppard
One of the biggest challenges of ‘remote coaching’ is an
inability to ‘eyeball’ the athlete on a daily basis. Thinking back to my days on
the pool deck, assessing when a swimmer was too tired to benefit
from a session was much easier than it is these days. It didn’t necessarily need to be quantified. It was made
clear in changes to the swimmer’s ‘every day’ stroke that a coach gets to know
so well after watching arm cycle after arm cycle over months and years of
preparation.
When it comes to preventing over-training, swimming benefits
from the fact that it is a technical sport. The movement is sufficiently
complex that tiredness “shows up”. Additionally, swimming programs typically
involve a mix of intensities in any given workout. This too, makes fatigue
evident. Training for Ironman triathlon, on the other hand, as a less complex/less intensity-diverse endeavour, can be quite a bit
more challenging both in terms of assessing and heeding the signs of day to day
tiredness in athletes. This is exponentially true when coaching is remote.
In this piece, I want to take a look at overtraining, especially among high volume Ironman athletes. I want to first offer a practical definition of overtraining and then
outline some simple signs that both coaches and athletes can use to determine
when “enough is enough”.
So what is over-training?
The term ‘over-training’ has come to mean different things
to different people depending on what side of the issue it’s being approached
from. The sports medicine community is generally concerned with The
Overtraining Syndrome – a serious chronic ‘injury’ to the hormonal systems of
the body that can severely compromise overall health and take months or even
years to recover from.
The sports science community, due to logistical and ethical
issues in eliciting the overtraining syndrome has focused more on
‘over-reaching’, i.e. training to a point of diminished performance. While
investigating this, researchers have often been forced to conclude that often
this over-reaching is actually functional and is a common thread in
sufficiently demanding training programs. And so, in coaching practice, the
definition of overtraining has remained a little nebulous & of limited
practical use.
As coaches, we are concerned with providing &
implementing programs that result in athletic improvement. Overtraining, then,
can be more broadly looked at as occurring when the amount of training and the
amount of improvement are out of whack. In this sense, the athlete is literally
“over training” for the results they are receiving. While this is an easy
enough concept to grasp, assessing it in the real world is a little more
challenging.
Rarely, will we, as coaches come across athletes suffering
from the over-training syndrome – where stress hormones are clinically affected
and the athlete’s long-term health is at stake. Frequently, however, we are
charged with the task of managing fatigue, i.e. deciding how tired is ‘tired
enough’. Instead of obvious ‘red lights’, we’re much more likely to come across
semi-frequent ‘yellow lights’ – indicators that the athlete is getting tired
but can still complete the training - where it’s very much a judgment call as
to whether we should hit the brakes or roll on through. If you’re of the same mindset
as the bulk of morning drivers that I seem to share the road with, you may be
asking “why not roll on through the yellow lights?” After all, we’ve got to get
to our destination. The reason is that, when these warning signs show up, the
athlete’s training response is already compromised, i.e.
while he/she can still do the training, the performance benefit that they get
from the training is not the same as when they are relatively fresh.
Studies are consistently finding a link between fatigue and
the degree of training response. For example, Hautala et al., (2003) found that
athletes with a low standard deviation in heart rate variability (174 ms) – a measure
of high autonomic fatigue, improved their VO2peak by 12% less than subjects
showing low autonomic fatigue (HRV of 195 ms) on the same training program!
That is, while all athletes were adapting to the program to some degree (none were meeting the
clinical criteria for over-training) some were just adapting better &
faster than others – specifically, the ones who had the lowest daily signs of
fatigue. These athletes were, on any one day, getting more performance ‘bang’
for their ‘training buck’. Given that all athletes are limited in one way,
either through time or energy, this training ‘return on investment’ is
important to maximize.
When athletes consistently train in a fatigued state, the
following pattern of a progressively lessening return on investment occurs –

The best coaches that I’ve seen in action do this
intuitively, i.e. like an experienced chef, they determine whether a pinch or a
dab is more appropriate to the recipe that day by drawing on an extensive experiential
database of indicators of fatigue for each given athlete. While this obviously
represents the ideal, science is also putting together its own database of tests
that consistently indicate autonomic fatigue and blunted training response & can be of great value to remote coaches & those without a decade of experience with an athlete in determining 'how much is enough'.
In next week’s article, I’ll take a look at some simple
daily tests that can keep this training response in the ‘sweet spot’ & tell
the athlete whether it’s a red light, yellow light or a ‘green light GO’ kind
of day.
Until then…
Train smart,
AC
Subscribe to:
Posts (Atom)